
jupuyer block使用plt.clf()
每次绘图时调用plt.clf(),反复执行block可以起到循环的效果,这在可视化增广效果的时候可以提高效率;
使用plt.text()前应使用plt.axis()
否则将会生成空白画布,一个t-SNE降维可视化的例子:
# text_feature_tsne.shape = (32,2)
fig = plt.figure(figsize=(10,10))
plt.axis([min(text_feature_tsne[:,0])-10, max(text_feature_tsne[:,0])+10,
          min(text_feature_tsne[:,1])-10, max(text_feature_tsne[:,1])+10])
for i in range(text_feature_tsne.shape[0]):
    plt.text(text_feature_tsne[i, 0]-25, text_feature_tsne[i, 1]-25, str(id2word_dict[text_id[i]]), color=(random.random(),random.random(),random.random()),
             fontdict={'weight': 'bold', 'size': 10})
plt.xticks([])
plt.yticks([])
plt.savefig("result.png")
plt.show()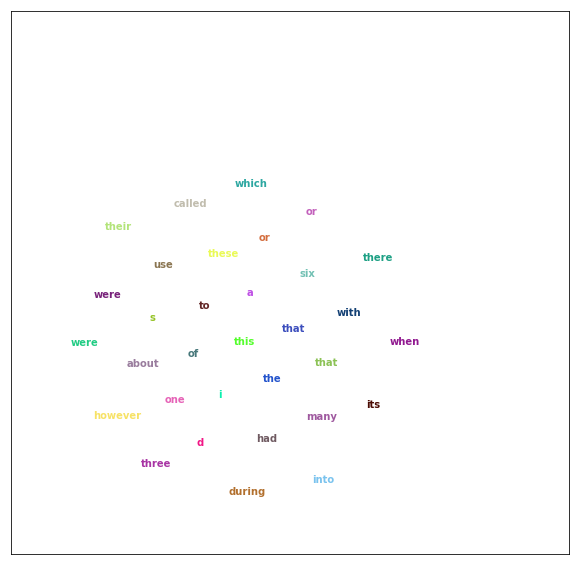
留言