
# -*- coding: utf-8 -*-
"""
author: 赵杭天
data: 20.1
base: official baseline
"""

from reader import data_loader
from glob import glob
from sklearn.cluster import KMeans

xmls_train = glob('./insects/train/annotations/xmls/*.xml')
xmls_val = glob('./insects/val/annotations/xmls/*.xml')

# print(len(xmls_train), len(xmls_val), len(xmls))
import xml.etree.ElementTree as ET
import os
import numpy as np

ct = 0
# records = [[{...}{...},...] , [{...},{...},...] ],第一个list放train的dict,第二个list放val的dict
records = [[],[]]

INSECT_NAMES = ['Boerner', 'Leconte', 'Linnaeus',
                'acuminatus', 'armandi', 'coleoptera', 'linnaeus']

def get_insect_names():
    """
    return a dict, as following,
        {'Boerner': 0,
         'Leconte': 1,
         'Linnaeus': 2,
         'acuminatus': 3,
         'armandi': 4,
         'coleoptera': 5,
         'linnaeus': 6
        }
    It can map the insect name into an integer label.
    """
    insect_category2id = {}
    for i, item in enumerate(INSECT_NAMES):
        insect_category2id[item] = i

    return insect_category2id

for split_section, xmls in enumerate([xmls_train, xmls_val]):
    cname2cid = get_insect_names()
    for fpath in xmls:
        tree = ET.parse(fpath)

        if tree.find('id') is None:
            im_id = np.array([ct])
        else:
            im_id = np.array([int(tree.find('id').text)])

        objs = tree.findall('object')
        im_w = float(tree.find('size').find('width').text)
        im_h = float(tree.find('size').find('height').text)
        gt_bbox = np.zeros((len(objs), 4), dtype=np.float32)
        gt_class = np.zeros((len(objs),), dtype=np.int32)
        is_crowd = np.zeros((len(objs),), dtype=np.int32)
        difficult = np.zeros((len(objs),), dtype=np.int32)
        for i, obj in enumerate(objs):
            cname = obj.find('name').text
            gt_class[i] = cname2cid[cname]
            _difficult = int(obj.find('difficult').text)
            x1 = float(obj.find('bndbox').find('xmin').text)
            y1 = float(obj.find('bndbox').find('ymin').text)
            x2 = float(obj.find('bndbox').find('xmax').text)
            y2 = float(obj.find('bndbox').find('ymax').text)
            x1 = max(0, x1)
            y1 = max(0, y1)
            x2 = min(im_w - 1, x2)
            y2 = min(im_h - 1, y2)
            # xywh
            gt_bbox[i] = [(x1 + x2) / 2.0, (y1 + y2) / 2.0, x2 - x1 + 1., y2 - y1 + 1.]
            is_crowd[i] = 0
            difficult[i] = _difficult

        voc_rec = {
            'im_id': im_id,
            'h': im_h,
            'w': im_w,
            'is_crowd': is_crowd,
            'gt_class': gt_class,
            'gt_bbox': gt_bbox,
            'gt_poly': [],
            'difficult': difficult
        }
        if len(objs) != 0:
            records[split_section].append(voc_rec)
        ct += 1

wh_total = [[],[]]
num_total = [[],[]]
for split_section, section_records in enumerate(records):
    print('%s gt bbox数量:' % ('train' if split_section == 0 else 'val'))
    # wh means width and height
    wh_cls_wise = [[] for i in range(len(INSECT_NAMES))]
    for r in section_records:
        for i in range(len(r['gt_bbox'])):
            bb = r['gt_bbox'][i][2:]
            bb[0] = bb[0] / r['w']
            bb[1] = bb[1] / r['h']
            wh_total[split_section].append(bb)
            wh_cls_wise[r['gt_class'][i]].append(bb)

    for i, c in enumerate(wh_cls_wise):
        print(INSECT_NAMES[i], ':\t', len(c))
        num_total[split_section].append(len(c))

    print('Total gt bbox: %d \n' % len(wh_total[split_section]))

# 绘图
import matplotlib.pyplot as plt

name_list = INSECT_NAMES
num_list_1 = num_total[0]
num_list_2 = num_total[1]
x =list(range(len(num_list_1)))
total_width, n = 0.8, 2
width = total_width / n

plt.figure(figsize=(10,8))
plt.bar(x, num_list_1, width=width, label='train', fc = 'g')
for i in range(len(x)):
    x[i] = x[i] + width
plt.bar(x, num_list_2, width=width, label='val',tick_label = name_list,fc = 'y')
plt.legend()
# plt.show()

anchor_num = 9
kmeans = KMeans(n_clusters=anchor_num, random_state=0).fit(wh_total[0]+wh_total[1])
cluster_results = list(608 * kmeans.cluster_centers_)
cluster_results.sort(key=lambda wh: wh[1] * wh[0])
print('anchor_num = %d, 聚类结果:%s' % (anchor_num,cluster_results))

import matplotlib.patches as patches
plt.figure(2)
plt.imshow(np.full((100,100,3), 255))
currentAxis=plt.gca()
for bbox in cluster_results:
    w, h = bbox
    rect=patches.Rectangle((50-w/2, 50-h/2),w,h,linewidth=1,edgecolor='r',facecolor='none')
    currentAxis.add_patch(rect)
plt.show()
各类别train/val统计柱状图
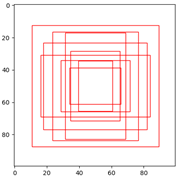
bbox聚类结果
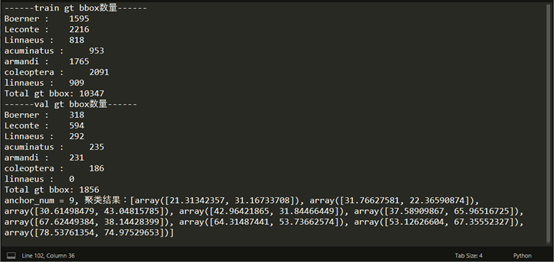
打印统计结果
留言